
Once your WordPress site is in production, you need visibility into how it’s performing. Are pages loading slowly? Are there PHP errors that users are encountering but not reporting? Is a database query suddenly taking 10 seconds? Without monitoring, you’re flying blind — you only find out about problems when users complain.
This guide covers how to set up performance monitoring for WordPress using New Relic for application performance monitoring and Sentry for error tracking.
Why Monitor WordPress Performance
Production monitoring serves two purposes: detecting problems before users notice them, and providing data to diagnose issues when they occur. A monitoring setup alerts you when response times exceed thresholds when error rates spike, or when key transactions fail. This proactive approach prevents small issues from becoming site-down emergencies.
Monitoring also helps you make better decisions. When you add a new feature or update a plugin, monitoring confirms that performance hasn’t regressed. When you optimize a slow page, monitoring confirms the improvement.
New Relic for Application Performance Monitoring
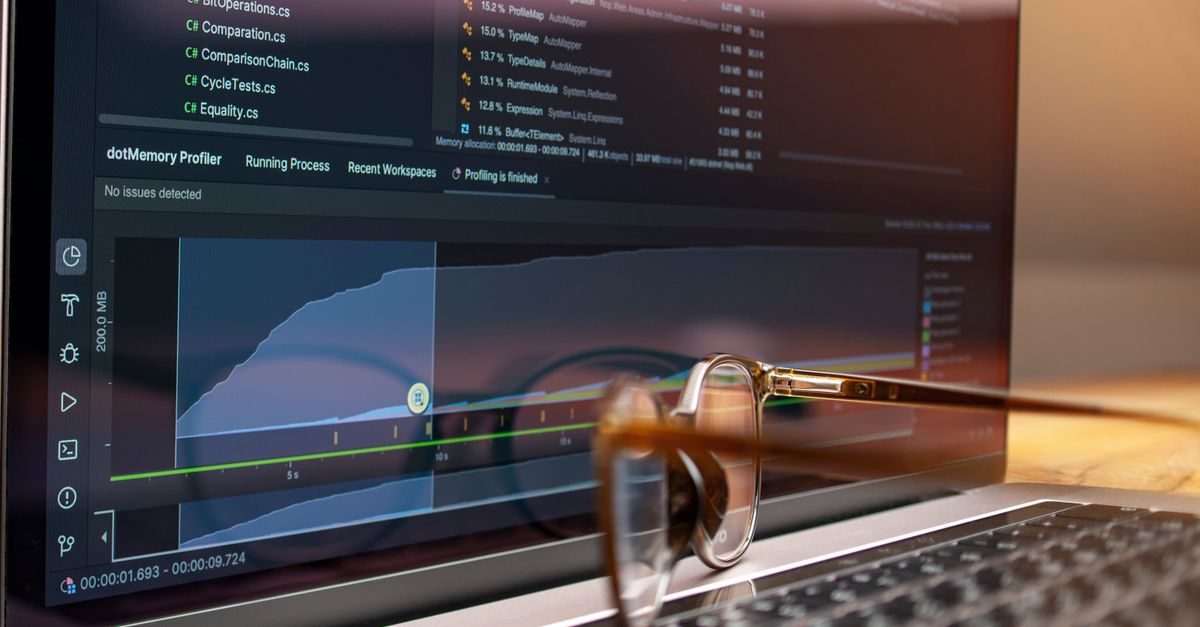
New Relic provides detailed visibility into your WordPress site’s performance. The New Relic PHP agent instruments your server and reports data on page load times, database query performance, external API call times, and PHP execution details. Install the PHP agent on your server, and New Relic automatically instruments WordPress without requiring code changes.
New Relic’s transaction traces show you exactly which functions are slow. When a page takes 5 seconds to load, New Relic shows you which database queries, API calls, or PHP functions are responsible. This makes performance optimization targeted rather than speculative.
Sentry for Error Tracking
Sentry captures PHP errors, JavaScript errors, and performance data from your WordPress site in real time. When an error occurs, Sentry captures the stack trace, user context, browser information, and the sequence of events that led to the error. This context makes debugging production issues significantly faster.
Install the Sentry WordPress plugin to integrate Sentry with your site. The plugin captures PHP errors automatically and sends them to Sentry’s dashboard. Configure Sentry to send email or Slack notifications when critical errors occur, so you’re alerted immediately.
Setting Up Alerts
Monitoring is useless if you don’t act on the data. Set up alerts for conditions that require immediate attention. Start with these alert conditions: error rate above 1% for more than 5 minutes, average page load time above 3 seconds, any 500-level HTTP error, and any PHP fatal error.
Configure alert channels appropriate for your team. Email for low-urgency issues, Slack or PagerDuty for critical alerts that need immediate attention. Set up a weekly summary email that shows performance trends, top errors, and overall site health.
WordPress-Specific Monitoring
Beyond general web performance monitoring, WordPress sites have specific metrics worth tracking. Monitor the number of active plugins and their versions — outdated plugins are a common source of performance regressions. Track database size growth — a rapidly growing database may indicate excessive post revisions, transients, or logs.
Monitor cron execution times. WordPress cron jobs that fail or run too long can cause cascading performance issues. Track PHP memory usage — WordPress sites with many plugins can exhaust memory limits during peak traffic. Monitor these metrics weekly to catch trends before they become emergencies.
The Bottom Line
Production monitoring separates professional WordPress operations from amateur maintenance. New Relic gives you visibility into performance bottlenecks, Sentry catches errors before users report them, and alerting ensures you know about problems quickly. The setup cost is minimal, and the return on investment is measured in prevented outages and faster debugging.